Trend Card and Comparing Multiple User Segments
Answered
I created a trend card in my dashboard and I’m trying to compare trends between two user segments.
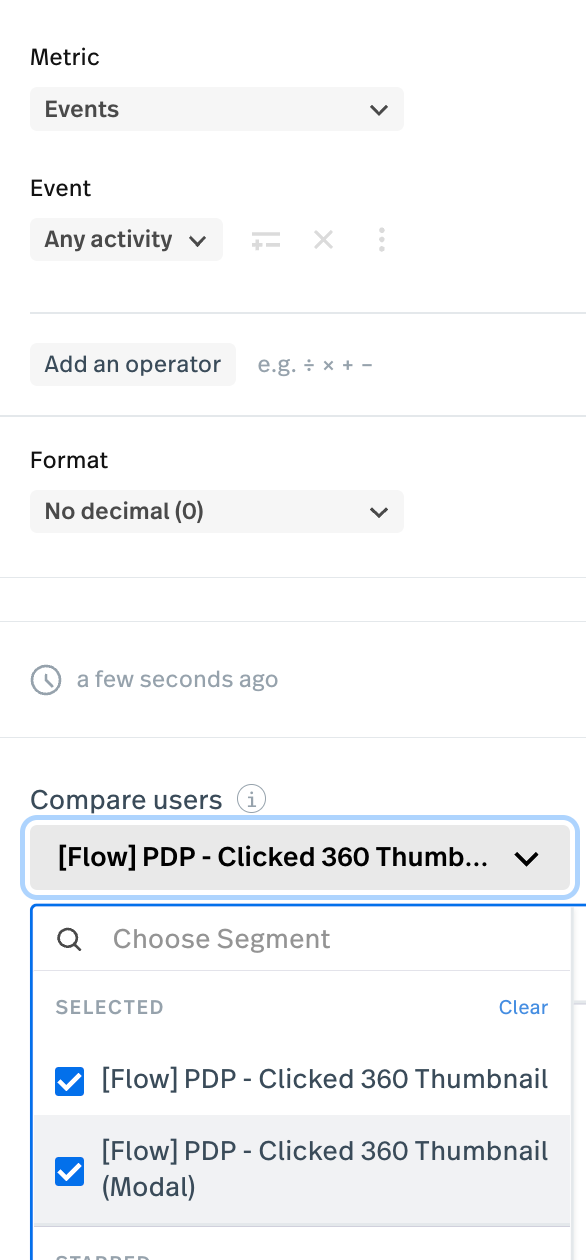
- Segment “Click a 360 image thumbnail”
- Segment “Click a 360 image thumbnail inside a Modal
My question is after adding these segments from the compare users dropdown, what event filters should I use? For Metric is have Events, and for Event I have Any activity. is that how it should be setup?
0
Comments
6 comments
Hey there @DataSeed99! Happy to help. To make sure I understand, it sounds like you’re trying to compare trends between users who clicked on the 360 thumbnail and users who clicked on 360 thumbnail within a modal. Is that right? Is your goal to compare the number of clicks, number of sessions, or number of users who completed these tasks? Based on what you’d like to measure, I can help you set things up in the best way!
Hi @megan I’d like to compare number of clicks so I can see which UI element got the most clicks….the 360 thumbnail on the page or the 360 thumbnail inside the modal. Also since this UI element is only available on our PDP page and nowhere else I didn’t further refine each event by page….just FYI.
Gotcha! Last question - do these thumbnails have the same CSS selector, or is there a different selector for the 360 thumbnail on the page and the 360 thumbnail in the modal?
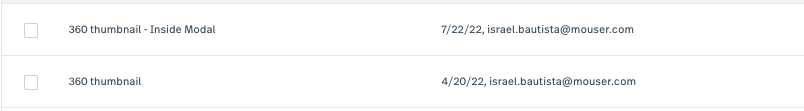
different selector….I actually have named elements for each one. 360 thumbnail and 360 thumbnail - Inside Modal
Thanks so much, @DataSeed99! So typically when you’re using the Compare Segments option on a Metric, it helps you see how two different groups of users compare for the same activity. For example, did mobile users or desktop users click “Add to Cart” more? The segments would be mobile and desktop users, and the metric would be count of events :: clicks on “Add to Cart.”
In this case since we’re looking at two different activities (clicks on the thumbnail vs. clicks on the thumbnail inside a modal), it would be best to use two different metrics and compare them side-by-side on a dashboard.
If you add those two metrics to a dashboard side by side, you can see the trends next to each other as either trend lines or metric counts.
thanks @megan this clarifies a little more the use of compare segments….not really why my mental model was when I was trying to use it.
To improve the usability of that feature I think it would ge helpful to add more information as to how the feature works. You could use the current tooltip, or better yet just add the text below the title. Adding some of your text would have removed some of my initial confusion, not to mentioned I couldn’t find any related info in your help articles about how the feature compares segments and the limitation about comparing the same activity.
“see how two different groups of users compare for the same activity.”
Please sign in to leave a comment.